The Agency Reporting Dashboard is a powerful tool for evaluating the performance of your marketing campaigns and understanding the revenue they generate. By monitoring these key metrics and analyzing trends over time, you can make informed decisions to optimize your marketing strategies and enhance your business's success.

Key Performance Indicators (KPIs) Section
This section of the dashboard provides a closer look at the KPIs for your paid advertising campaigns. Here's what you'll find:
1. Total Ad Spend
This represents the sum of ad spending invested across all platforms during the selected reporting period.
2. Total Leads
The total number of leads generated during the reporting period.
3. Cost per Lead (CPL)
CPL is the cost associated with obtaining lead information through your campaigns, helping you understand the efficiency of lead generation.
4. Total Purchases
This metric indicates the total number of purchases generated by Referrizer Agency leads within the reporting period.
5. Cost per Purchase
Cost per Purchase is the relationship between ad spend and the number of purchases during the reporting period, providing insights into your campaign's cost-effectiveness.
6. Return on Ad Spend (ROAS)
Similar to the earlier ROAS, this metric is calculated by dividing the total ad spend during the reporting period by the total revenue generated from ads.
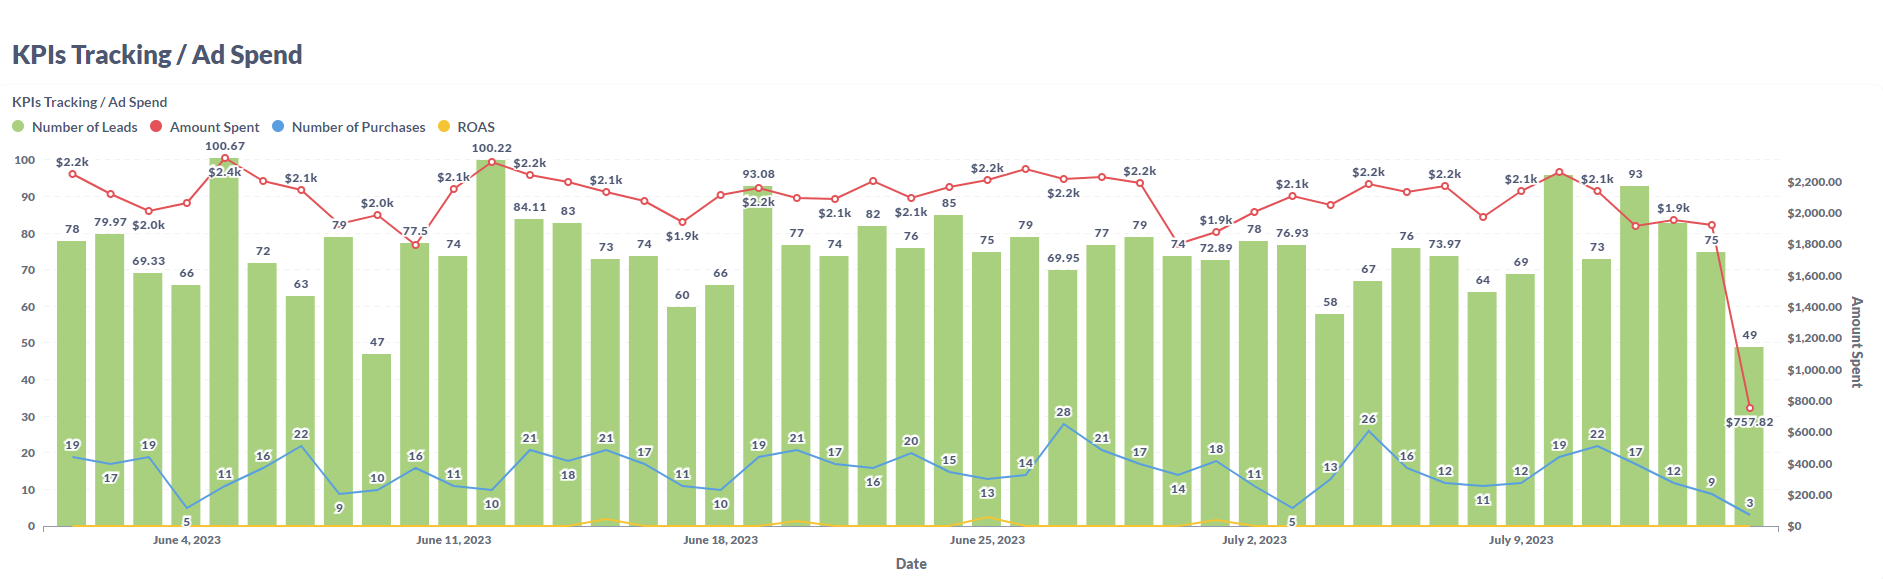
KPI`s Tracking Chart
This chart represents the main KPIs of your campaign (Ad Spend, Number of Leads, Number of Purchases, and ROAS) over the selected period of time.