The pipeline report provides a clear and organized view of all leads at various stages of the customer journey and predicts future sales and revenue. This information is crucial for making informed business decisions, planning marketing strategies, and setting realistic sales targets.
You can easily access it via sidebar navigation, under the Reports drop-down menu:
- Click on the Reports button.
- Click on the Pipeline option and the report's page will open
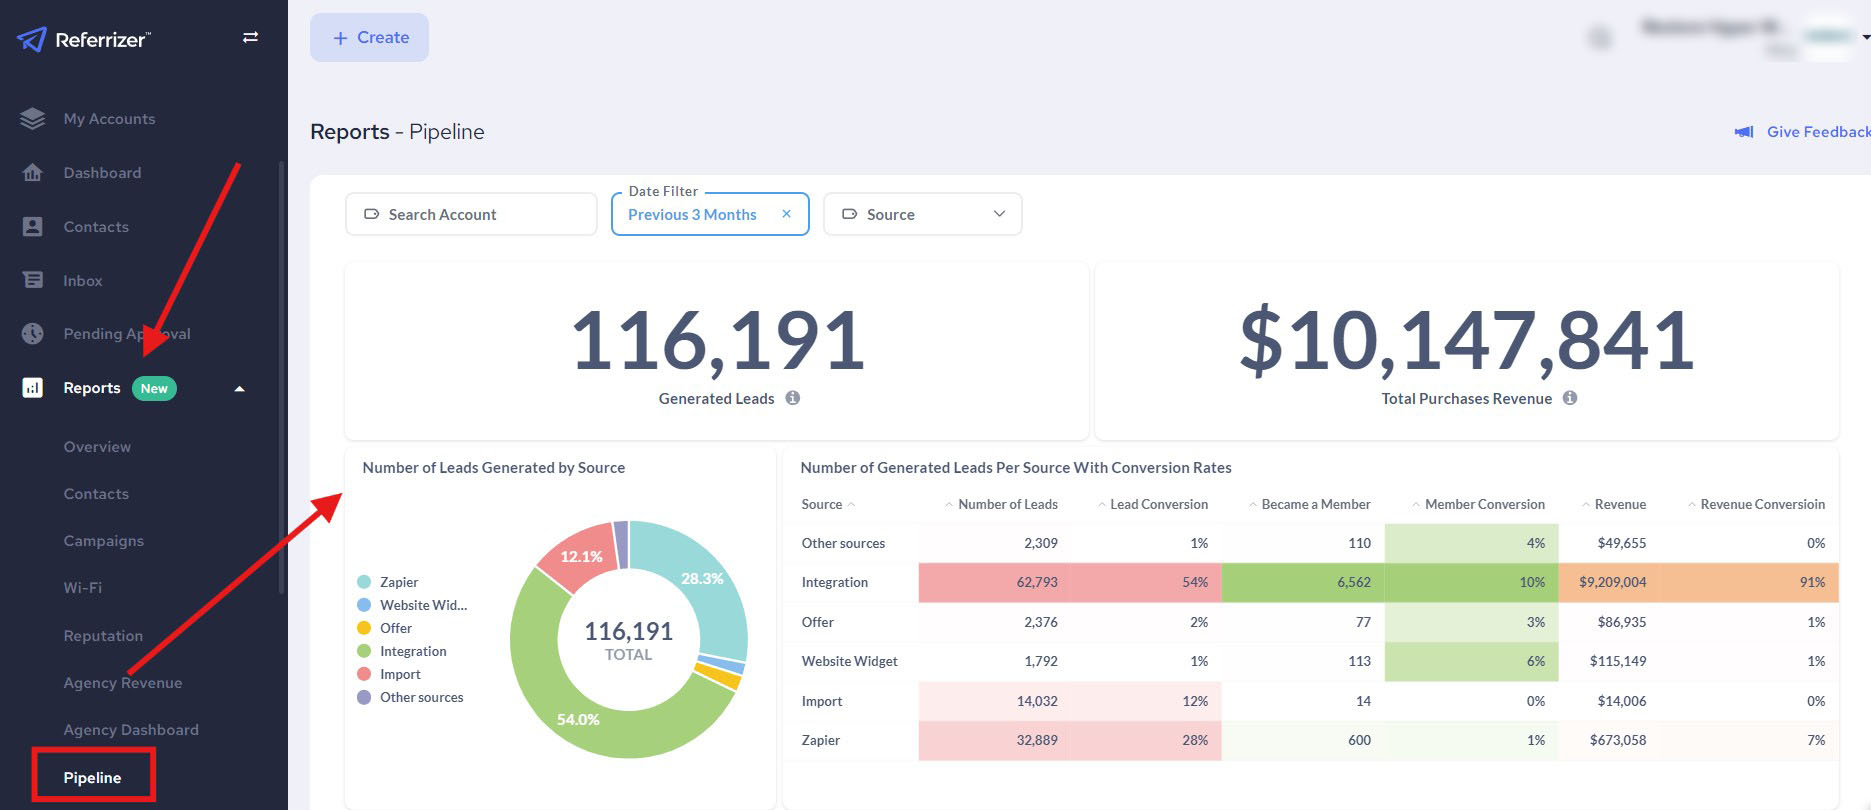
Functionalities you have available within your report:
- Search box - Look for a particular location from the list of locations associated with your business.
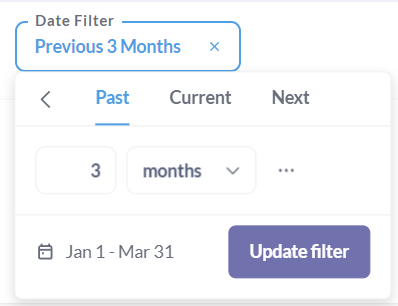
- Date Filter - Data from the last three months have been presented by default. Clicking on this field you can select some custom date range.
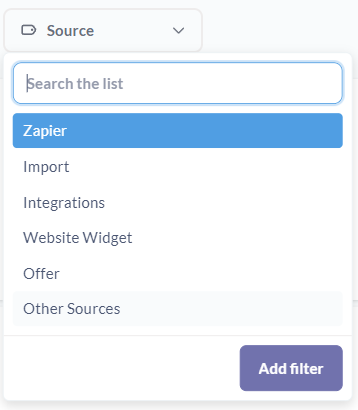
3. Source Filter - Select the source of your leads you would like to look after. Investigate which one brings you more benefits, and which may not. Plan and create additional campaigns based on results you can see here.
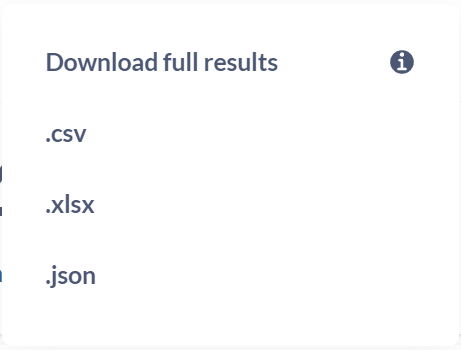
4. Export Your Report - Each data block has an option in the upper right corner for downloading results.
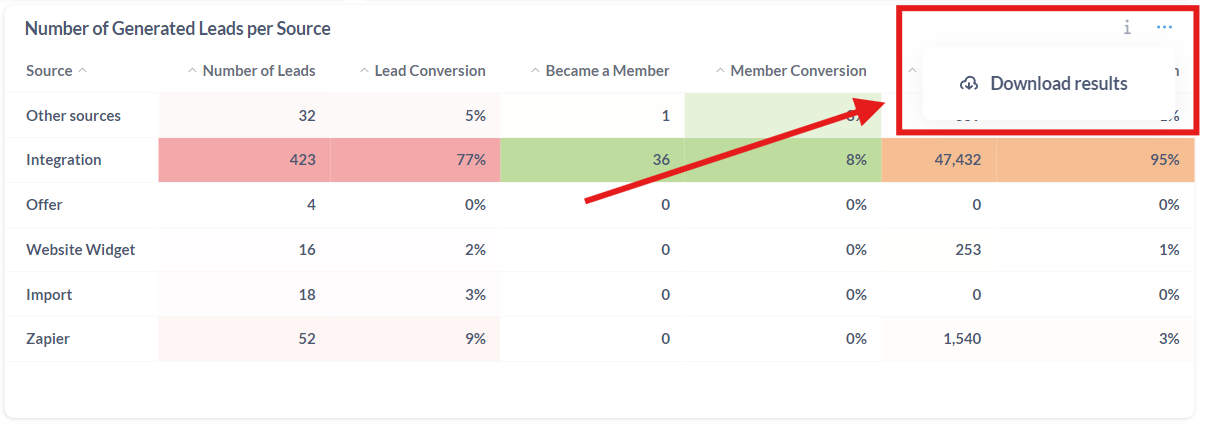
Clicking on Download results you will be able to select the type of document you would your results to be downloaded in.
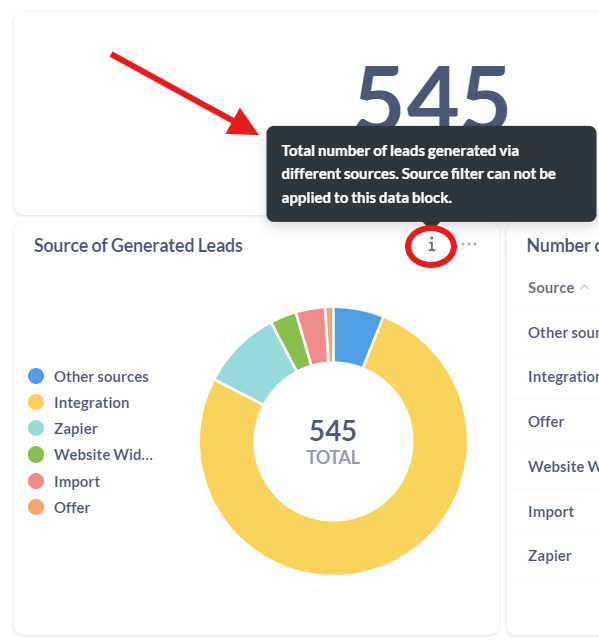
5. Tooltips - On hovering over a tooltip icon an additional explanations are added on each data block.
Key Performance Indicators (KPIs) included in this report are for all locations or individual ones associated to your business.
Description of KPIs:
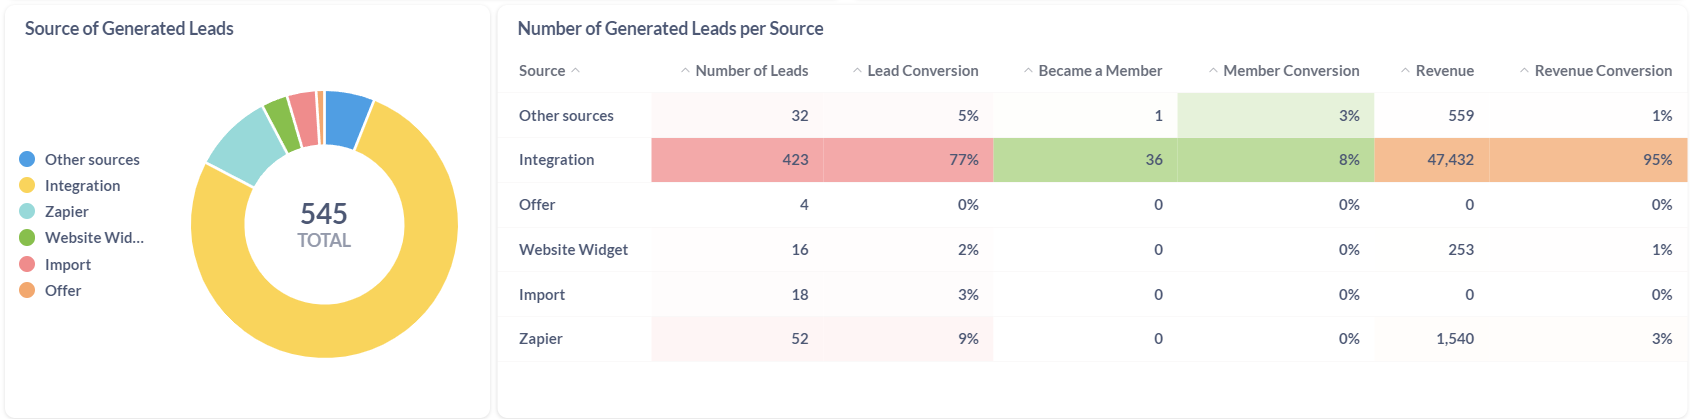
- A total number of leads generated via all available sources for a selected period.
- Revenue these leads have made.

- Number of generated leads broken down per each source together with conversions made per each source: Leads Conversion, Member Conversion and Revenue Conversion.
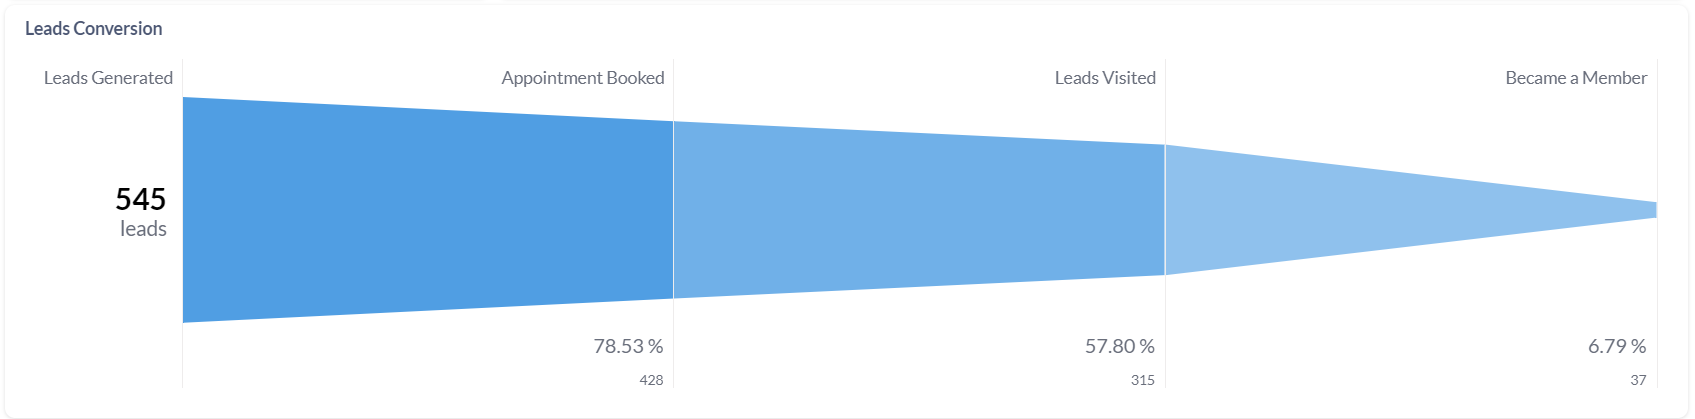
- Funnel with following key leads conversion points:
Leads Generated - total number of leads generated for selected date and source filters.
Appointment Booked - percentage of appointments booked by these leads.
Leads Visited - percentage of visits made by these leads.
Became a Member - percentage of memberships made by these leads.
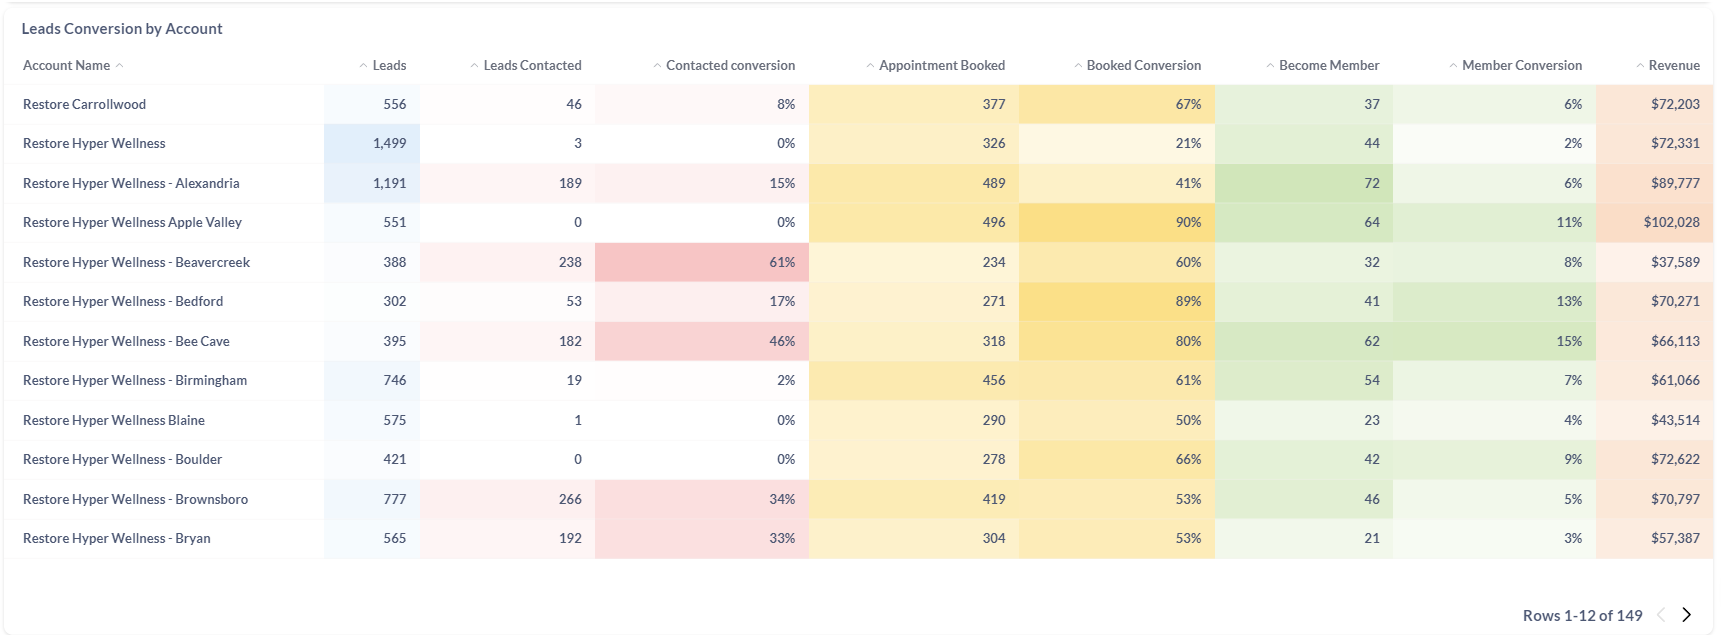
- Leads Conversion by Account follow up the conversion rate for key performance steps.
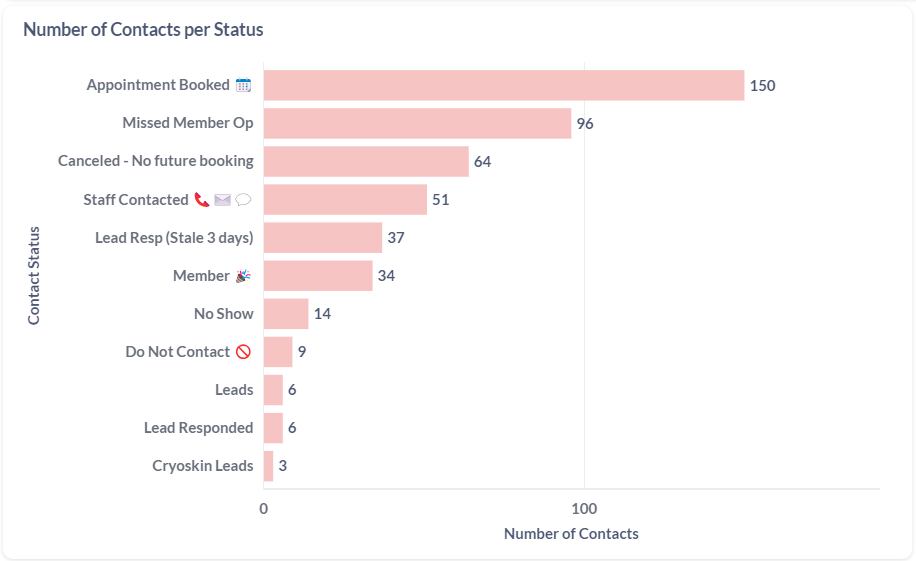
- Bar chart presenting all pipeline statuses and number of leads per each. Date and source filters are applicable to these blocks.
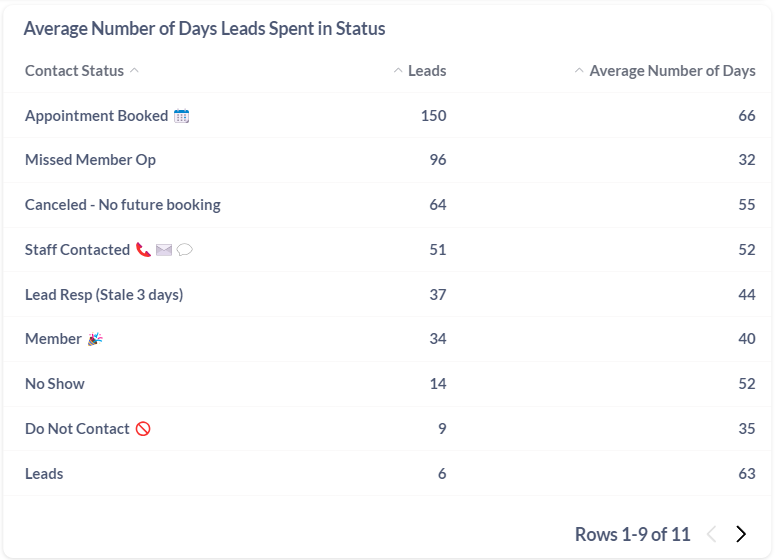
- In addition to the previous chart is a table view with one column presenting the average number of days leads spend in each.
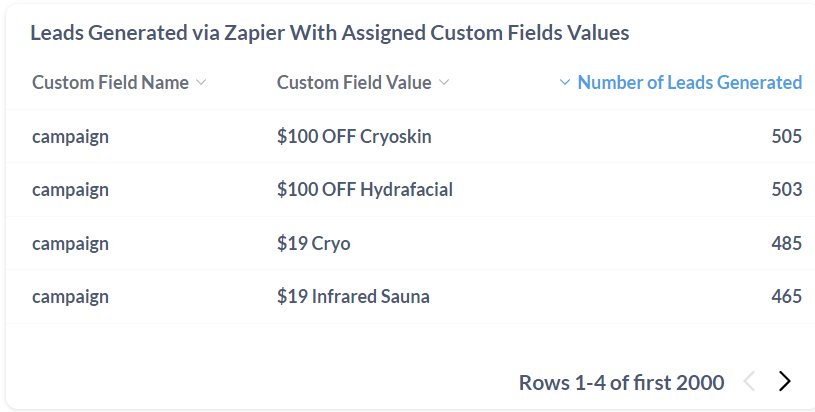
- Leads Generated via Zapier With Assigned Custom Fields Values - all custom fields your locations have been created in their account would be listed in this table view together with its values and number of leads generated per each value.
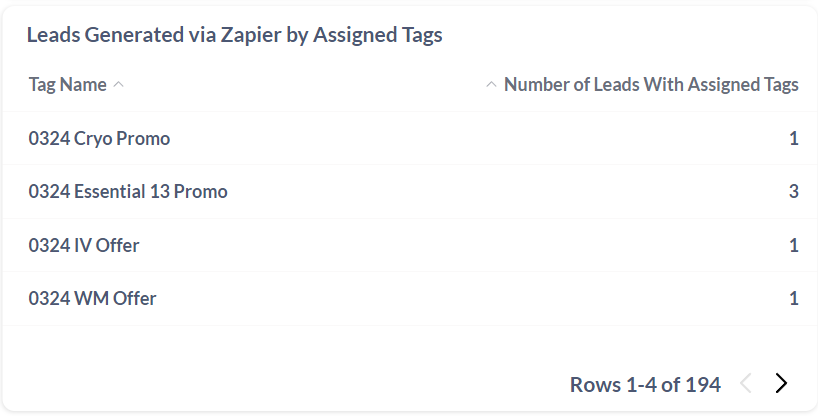
- Leads Generated via Zapier by Assigned Tags - Referrizer tags can easily be used as labels in your Zaps. This way your leads may be marked and presented in this table view closely defining the source of your leads.
- The last table view presents the detailed break down of your generated leads for each location per individual source.
The data presented in this report reflects pipeline usage starting from the feature release date on August 1st, 2023. Please note that any analysis or insights drawn are based on data collected from that point onwards.